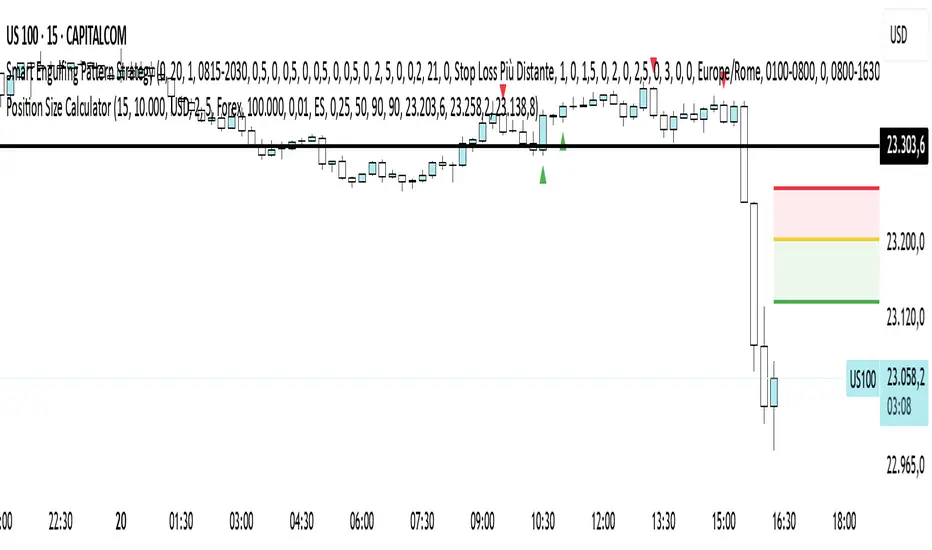
Position Size CalculatorPosition Size Calculator - User Guide
A simple tool to calculate optimal position size based on your risk preferences, visualize trade levels, and automatically determine trade direction.
Introduction
The Position Size Calculator is a TradingView indicator designed to help traders calculate the optimal position size for their trades based on account size and risk tolerance. This tool visually represents entry, stop loss, and take profit levels while automatically calculating the appropriate position size to maintain consistent risk management.
Getting Started
Setting Up Your Account Parameters
Setting Price Levels
Understanding the Visual Elements
Adjusting Your Trade on the Chart
Reading the Information Panel
1. Getting Started
After adding the indicator to your chart, you'll see three horizontal lines representing:
Yellow line: Entry price
Green line: Take profit price
Red line: Stop loss price
The indicator automatically detects whether you're planning a Long or Short trade based on the position of your take profit relative to your entry.
2. Setting Up Your Account Parameters
In the "Position Calculator" settings group:
Account Size : Enter your total account balance
Account Currency : Set your account currency (USD, EUR, etc.)
Risk (%) : Enter the percentage of your account you're willing to risk per trade (e.g., 2%)
Instrument Type : Select your trading instrument (Forex, Futures, Stocks, or Crypto)
Value per 0.01 lot per tick : Enter the value of 0.01 lots per tick (for most Forex pairs, this is $1 per pip for 0.01 lot)
Minimum Lot Size : Set the minimum lot size allowed by your broker (usually 0.01 for Forex)
3. Setting Price Levels
In the "Price Levels" section:
Entry Price : The price at which you plan to enter the trade
Stop Loss Price : Where you'll exit if the trade goes against you
Take Profit Price : Your target price where you'll take profits
If you set Entry Price to 0, it will default to the current price. If Stop Loss or Take Profit are set to 0, they'll default to 5% below or above entry price respectively.
4. Understanding the Visual Elements
Yellow line : Your entry price
Green line : Your take profit level
Red line : Your stop loss level
Green zone : The profit zone (between entry and take profit)
Red zone : The loss zone (between entry and stop loss)
Information panel : Shows all calculations and trade details
5. Adjusting Your Trade on the Chart
The beauty of this tool is its interactivity:
You can drag any of the lines directly on the chart to adjust entry, stop loss, or take profit
If you drag the take profit above the entry , the indicator automatically sets up for a Long trade
If you drag the take profit below the entry , it automatically configures for a Short trade
All calculations and visuals update in real-time as you adjust the lines
This means you can quickly test different scenarios and see how they affect your position size and potential profit/loss.
6. Reading the Information Panel
The information panel displays:
Account details : Your account size and currency
Risk information : Your percentage risk and the equivalent monetary amount
Position Size : The optimal lot size calculated based on your risk parameters
Price levels : Entry, Stop Loss, and Take Profit with distances in ticks
Risk/Reward ratio : Shown as 1:X (where X is the reward relative to 1 unit of risk)
Potential outcomes : The exact amount you stand to gain or lose on this trade
Trade direction : Whether this is a Long or Short trade
Visual Settings
You can customize the appearance in the "Visual" settings group:
Adjust colors for profit and loss zones
Change the transparency of colored zones
Toggle the filling of spaces between lines
Adjust how far the lines extend beyond the last candle
Practical Tips
Always double-check your "Value per 0.01 lot per tick" setting for the specific instrument you're trading
For Forex major pairs, the standard is usually $1 per pip for 0.01 lots
For other instruments, consult your broker's specifications
The indicator works best when you place your stop loss at a logical market level (support/resistance, swing high/low) rather than a fixed percentage
Final Thoughts
This Position Size Calculator helps remove emotion from your trading by objectively calculating your position size based on your predefined risk parameters. It ensures that you maintain consistent risk across all your trades, regardless of the stop loss distance, which is a key component of successful risk management.
Remember: The most important goal in trading is capital preservation. This tool helps you ensure that each trade risks only what you've decided is acceptable for your trading strategy.
[b]forex
Intraday Pivot Highs & Lows (Asia London NY)Intraday Pivot Highs & Lows (Asia London NY)
Script Description
This TradingView indicator is optimized for Forex, scalping, intraday, and day trading strategies. It accurately plots Pivot Points and levels, high/low, support and resistance levels. These are clearly identified to aid the trader during killzone sessions and session opens. Ideal for scalp trading, intraday sessions, and leveraging SMT (Smart Money Techniques). Utilize these Price Levels effectively during London Open, NY Open, and the Asia Session, utilizing Market Structure to pinpoint key levels and reversal zones for successful trading. Improve your Trade Setups, recognize reliable Chart Patterns, identify critical Price Pivots, and trade confidently off Institutional Levels.
This script marks the intraday pivot highs, lows and midpoints retracement levels for
Asia
London
New York
It also plots the previous day's high, low, midpoint, and 0.618 Fibonacci retracement levels, providing traders with critical price reference points for making intraday trading decisions.
Originality & Usefulness
This indicator uniquely integrates pivot calculations across three major Forex sessions (Asia, London, NY), clearly delineating session boundaries.
It enhances visibility by using distinct styling
solid for New York
dashed for London
dotted lines for Asia
And colour co-ordinated labeling, improving traders' ability to identify important intraday price action zones efficiently. Unlike standard pivot indicators, this script emphasizes session-specific trading dynamics.
### Key Features ###
Session-Based Levels: Automatically plots high, low, midpoint, and Fibonacci (.618) levels for each major session (Asia, London, NY).
Distinct Visual Cues: Lines and labels use session-specific styles and colors to easily differentiate between sessions.
Previous Day Reference: Clearly plots and labels yesterday's high, low, midpoint, and Fibonacci levels.
Flexible Visibility: Traders can set timeframe visibility to maintain clean charts on higher timeframes.
### How It Works
At the start of next day's session, previous session lines are cleared, ensuring the chart remains uncluttered.
High, low, midpoint, and Fibonacci retracement levels (.618) are dynamically calculated and displayed at the close of each session.
All session levels remain visible until the start of the next respective session, providing continuous actionable insights.
Trading Application:
Session highs and lows act as strong intraday support and resistance zones.
Midpoints and Fibonacci levels are effective for identifying potential reversal zones and retracements.
Daily levels provide a broader context, useful for gauging intraday volatility and range.
### Limitations and Considerations ##
Best used on liquid assets with clear session-based price action, such as Forex major pairs, if used on indexes make sure they contain 24 hour price action not just New York session.
This indicator is designed to streamline intraday trading by clearly marking essential pivot points and session-based levels, significantly improving traders' market context and decision-making accuracy. Can be used to enhance SMT decision making when scalping killzones.

Avg Session & Daily Volatility (Pips) - Forex/CFDS🔍 Overview
The Avg Session & Daily Volatility (Pips) indicator measures the average High–Low range (volatility) of three major Forex sessions—Asia, London, New York—and the entire trading day, then displays the results in a compact overlay table.
⚙️ Key Features
Session Windows
Asia: Default 23:00 – 07:00 server time
London: 07:00 – 16:00
New York: 13:00 – 22:00
Daily Range
– Tracks the full High–Low from midnight to midnight.
Flexible Lookback
– Choose 1W / 2W / 4W / 8W (≈ 5 / 10 / 20 / 40 trading days)
Pip Conversion
Forex Pairs: 1 pip = 0.0001 → (ticks / mintick) / 10
XAU/USD (Gold): 1 pip = 1 USD → direct price difference
Custom Styling
– Pick your own colors per session & daily
– Table position: Left/Center/Right × Top/Middle/Bottom
📈 Benefits & Use Cases
Optimal Stop-Loss & Take-Profit
Gauge each session’s typical movement to size SL/TP appropriately.
Intraday Performance Check
Compare your real-time trade swings against historical averages.
Risk Management
Align position sizes with average volatility to control risk.
Multi-Asset Support
Works seamlessly for major Forex pairs and Gold (XAU/USD) thanks to smart pip logic.
🚀 How It Works
Session Scanning – Continuously tracks the session’s high and low.
Array Storage – At session close, calculates range in pips and pushes it into a rolling buffer.
Averaging – Computes the arithmetic mean of the last N values (your chosen lookback).
Visualization – Paints the four averages in a neat 2×5 table overlay.
👍 Pro Tips
Check Your Time Zone – Make sure chart timezone matches your broker’s session times.
Tweak Lookback – Use shorter windows (1W) to react quickly; longer (4–8W) to smooth out outliers.
Combine Indicators – Pair with volume or trend tools for deeper insights.
Happy Trading,
Riseofatrader
Weekly Open Range [BigBeluga]
A precision weekly range tracker that captures early market positioning from the first moments of the trading week.
By dynamically measuring the highest and lowest points from the first three candles after the Sunday 21:00 UTC open, the indicator builds a reactive support and resistance framework for the week ahead.
It also visualizes the active range with a dynamic box and provides live updates of the current price movement against the established range boundaries.
🔵 KEY FEATURES
Automatically marks the weekly open range starting at Sunday 21:00 UTC .
Identify maximum high and minimum low from the first 3 candles after the weekly open.
if isWeeklyOpen or isWeeklyOpen or isWeeklyOpen or isWeeklyOpen
h = math.max(high, range_box.get_top())
l = math.min(low, range_box.get_bottom())
Draws two horizontal lines from the range extremes, acting as dynamic support/resistance zones throughout the week.
Visualizes the range with a semi-transparent box for clear zone identification.
Includes a compact dashboard panel with:
- Symbol and current price with bullish or bearish bar indication with ▲ / ▼
- Current weekly high/low range values
🔵 USAGE
Treat the high and low of the range as support/resistance zones for the week.
Combine with volume analysis or liquidity tools for entry confirmation .
Refresh your key levels every week as the indicator resets each Sunday night .
Works great alongside Smart Money Concepts (ICT) strategies and weekly planning.
Weekly Open Range gives traders a reliable structure to anchor their week. With clear range mapping, breakout signals, and intuitive visuals, it becomes a valuable part of any strategic trading approach—especially when precision timing around liquidity zones is key.

Market Sessions & Viewer Panel [By MUQWISHI]▋ INTRODUCTION :
The “Market Sessions & Viewer Panel” is a clean and intuitive visual indicator tool that highlights up to four trading sessions directly on the chart. Each session is fully customizable with its name, session time, and color. It also generates a panel that provides a quick-glance summary of each session’s candle/bar shape, helping traders gain insight into the volatility across all trading sessions.
_______________________
▋ OVERVIEW:
_______________________
▋ CREDIT:
This indicator utilizes the “ Timezone — Library ”. A huge thanks to @n00btraders for effort and well-organized work.
_______________________
▋ SESSION PANEL:
The Session Panel allows traders to visually compare session volatility using a candlestick/bar pattern.
Each bar represents the price action during a session and includes the session status, session name, closing price, change(%) from open, and a tooltip that reveals detailed OHLC and volume when hovered over.
Chart Type:
It offers two styles Bar or Candle to display based on traders’ preference
Sorting:
Allowing to arrange session candles/bars based on…
—Left to Right: The most recently opened on the left, moving backward in time to the right.
—Right to Left: The most recently opened on the right, moving backward in time to the left.
—Default: Arrange sessions in the user-defined input order.
_______________________
▋ CHART VISUALIZATION:
The chart visualization highlights each trading session using color-coded backgrounds in two selectable drawing styles that span their respective active timeframes. Each session block provides session’s name, close price, and change from open.
Chart Type: Candle
Chart Type: Box
Extra Drawing Feature:
This feature may not exist in other indicators within the same category, it extends the session block drawing to the projected end of the session. This's done through estimation based on historical data; however, it doesn’t function fully on seconds-based timeframes due to drawing limitations.
_______________________
▋ INDICATOR SETTINGS:
Section(1): Sessions
(1) Universal Timezone.
(2) Each Session: Enable/Disable, Name, Color, and Time.
Section(2): Session Panel
(1) Show/Hide Session Panel.
(2) Chart Type: Candle/Bar.
(3) Bar’s Up/Down color.
(4) Width and Height of the bar.
(5) Location of Session Panel on chat.
(6) Sort: Left to Right (most recent session is placed on the left), Right to Left (most recent session is placed on the right), and Default (as input arrangement).
Section(3): Chart Visualization
(1) Show/Hide Chart Block Visualization.
(2) Draw Shape: Box/Candle.
(3) Border Style and Size.
(4) Label Styling includes location, size, and some essential selectable infos.
Please let me know if you have any questions

Trading Sessions [BigBeluga]
This indicator brings Smart Money Concept (ICT) session logic to life by plotting key global trading sessions with volume and delta analytics. It not only highlights session ranges but also tracks their midpoints — which often act as intraday support/resistance levels.
🔵 KEY FEATURES
Visual session boxes: Plots boxes for Tokyo, London, New York, and Sydney sessions based on user-defined UTC+0 time ranges.
Volume & delta metrics: Displays total volume and delta volume (buy–sell difference) within each session.
Mid, High & Low Range Extension: Once a session ends, the high, low, and midpoint levels automatically extend — ideal for detecting SR zones.
Session labels: Each box includes a label with session name, time, volume, and delta for quick reference.
Custom session control: Enable or disable sessions individually and configure start/end times.
Clean aesthetics: Transparent shaded boxes with subtle borders make it easy to overlay without clutter.
Sessions Dashboard: Shows the time range of each session and tells you whether the session is currently active.
🔵 USAGE
Enable the sessions you want to monitor (e.g., New York or Tokyo) from the settings.
Use session volume and delta values to gauge the strength and direction of institutional activity.
Watch for price interaction with the extended range — it often acts as dynamic support/resistance after the session ends.
Overlay it with liquidity tools or breaker blocks for intraday strategy alignment.
🔵 EXAMPLES
Extended Future Range acted as resistance/support.
Delta value helped confirm bullish pressure during New York open.
Multiple sessions helped identify kill zone overlaps and high-volume turns.
Trading Sessions is more than just a visual scheduler — it's a precision tool for traders who align with session-based volume dynamics and ICT methodology. Use it to define high-probability zones, confirm volume shifts, and read deeper into the true intent behind market structure.

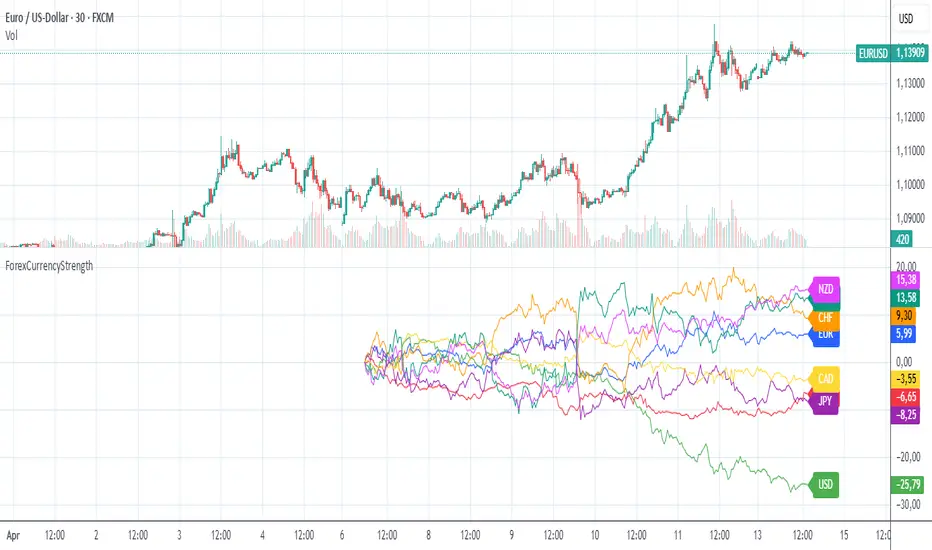
ForexCurrencyStrengthThe "ForexCurrencyStrength" indicator is a powerful tool designed to analyze the relative strength of the eight major currencies in the Forex market: EUR, USD, GBP, JPY, CHF, CAD, AUD, and NZD.
🔍 What does this indicator do?
The ForexCurrencyStrength indicator calculates the strength of each currency based on price changes across a variety of major currency pairs. It analyzes logarithmic returns (Log Returns) from 28 Forex pairs to give a comprehensive view of the market strength of each individual currency.
⚙️ How does it work?
The indicator calculates the strength of each of the 8 currencies by analyzing the changes in relevant currency pairs.
The strength is calculated based on the cumulative price changes since a user-defined start date.
Each currency is plotted as a separate line on the chart for easy comparison and identification of trends.
📅 Custom Start Date
You can set a custom start date for the calculation, allowing you to begin analysis from an important event or any preferred date.
📈 Use Cases
Identify the strongest and weakest currencies at a glance.
Help in choosing optimal Forex pairs for long or short trades.
Ideal for trend-following and relative strength strategies in Forex trading.
🎨 Features
Clear line plots for each currency.
Color-coded for easy visual differentiation.
Real-time values displayed as labels directly on the chart.
Gradient Range [BigBeluga]
This indicator highlights range-bound market conditions by dynamically plotting gradient-colored candlesticks within a defined price box. It detects whether the market is ranging or trending using ADX and can identify mean reversion points when price steps outside the established range.
🔵KEY FEATURES:
Range Detection Box:
➣ A transparent box is drawn based on the highest and lowest price close over a user-defined period.
➣ Helps visualize range boundaries and the midline for support/resistance reference.
Gradient Candlestick Coloring:
➣ Candles inside the range are colored with a gradient from top to bottom based on proximity to the midline.
➣ Top range candles are shaded with bearish tones, while bottom range candles use bullish tones.
Ranging/Trending State Detection:
➣ Uses ADX to determine if the market is currently in a ranging or trending state.
➣ A label in the bottom right corner shows a real-time status (🟢 Ranging / 🟡 Trending).
Mean Reversion Signal Circles:
➣ When the market is ranging, white circles are plotted at highs/lows that breach the box boundary, indicating potential mean reversion points.
➣ These levels can act as fade trade setups or exhaustion markers.
🔵USAGE:
Range Trading: Trade between the upper and lower boundaries during range-bound conditions with clearer visual feedback.
Mean Reversion Plays: Use circle signals as early alerts to identify when price extends beyond the range and may revert to the mean.
Visual Trend Strength: Instantly recognize where price is concentrated inside the range via the color gradient system.
Ranging Filter: Use the ADX label to avoid false setups during strong trending periods.
Gradient Range provides an elegant and data-driven approach to range-bound market analysis. With its gradient visualization and smart reversion detection, it empowers traders to better time entries and exits within consolidation zones.

CAM | Currency Strength PerformanceOverview 📊
The "CAM | Currency Strength Performance" indicator is a powerful forex trading tool that blends traditional composite analysis with dynamic performance tracking! 🚀 It compares the strength of a currency pair’s base and quote currencies against the pair’s price movement, offering traders a clear, colorful view of market dynamics through normalized lines and an upgraded strength-based histogram. 🎨
How It Works 🛠️
🔍 Automatic Currency Detection: Instantly identifies the base (e.g., XAU in XAUUSD) and quote (e.g., USD) currencies—no setup required!
📈 Composite Strength Calculation: Measures each currency’s power by averaging its exchange rate against a basket of 10 major currencies (GBP, EUR, CHF, USD, AUD, CAD, NZD, JPY, NOK, XAU). A classic strength snapshot! 💪
📏 Normalization: Scales composites and pair prices with a smart formula (price minus moving average, divided by standard deviation) for easy comparison. ⚖️
🎨 Dynamic Visualization:
Plots 3 normalized lines with unique colors:
Base Composite
Quote Composite
Actual Pair (⚪ white)
Benefits 🌈
🧠 Simplified Analysis: Normalized composites make static strength clear, while the new histogram reveals dynamic trends.
✅ Enhanced Decisions: Color-coded lines and a performance-driven histogram pinpoint trading opportunities fast—spot when base or quote takes the lead! 🚨
⏱️ Time-Saver: Auto-detection and dual metrics (static + dynamic) streamline your workflow.
🌍 Versatile: Works across all supported pairs, with colors adapting to currencies (e.g., orange AUD, yellow XAU).
👀 Eye-Catching: Vibrant visuals (purple GBP, green USD) and a purple histogram make it engaging and intuitive.
How It Helps Traders 💡
📈 Spot Trends: Normalized lines show steady strength; the histogram tracks recent outperformance—perfect for timing trades.
⚠️ Catch Divergences: See when strength shifts (e.g., base surging, quote lagging) don’t match price—hello, reversal signals! 🔍
🛡️ Manage Risk: Levels (1, -1) and histogram swings help gauge overbought/oversold conditions for smarter stops.
🔮 Big Picture: Combines static strength with dynamic momentum, giving a fuller market view for scalping or long-term strategies.
Conclusion ✨
"CAM | Currency Strength Performance" now fuses classic strength analysis with real-time performance tracking. With its upgraded histogram, traders get a dual lens—static composites plus dynamic strength—turning complex forex data into actionable insights! 📈💰
Mar 11
Release Notes
✨ New Feature: Strength Histogram:
Tracks the performance of base and quote currencies over a customizable lookback period (default: 10 bars). 📅
Calculates strength as the currency’s percentage change minus the basket’s average change, then plots the difference (base - quote) as a purple histogram. 📊
⚙️ Customizable Settings: Adjust Scaling Period (50), Histogram Scale Factor (0.5), Lookback Bars (10), and Levels (1, -1) to fit your trading style! 🎚️
How It Differs from the Previous Version 🔄
Old Histogram:
Showed the static difference between normalized base and quote composites—a snapshot of relative strength at a single point in time. 📷
Focused on current exchange rate levels, scaled by the pair’s normalized price movement.
New Histogram:
Displays the dynamic strength difference (base strength - quote strength) over a user-defined lookback period (e.g., 10 bars). 🌊
Measures past and current performance by calculating percentage changes relative to a basket, highlighting momentum and trends. 📈
Offers a more responsive, time-based view, showing how each currency has performed recently rather than just its absolute strength.

DT_KEY_LEVELSDT_Key_Levels: Powerful Market Structure Analysis Indicator
DT_Key_Levels is an advanced indicator for fundamental market structure analysis, optimized for higher timeframes (D1, W, M). The indicator combines three powerful technical analysis tools — fractals, Fair Value Gaps (FVG), and psychological levels — in one comprehensive solution.
Three Components of the Indicator
1. Enhanced Fractal System
The indicator uses an improved version of Bill Williams' classic fractals, allowing for deeper market structure analysis:
Dual Identification System:
Standard 5-bar fractals (displayed with thick lines) for analyzing reliable support/resistance levels
Light 3-bar fractals (displayed with thin lines) for early identification of potential reversal points
Intelligent Tracking System:
Automatic detection and filtering of completed fractals
Marking fractals with corresponding timeframe designation (HTF-1D, HTF-1W, HTF-1M)
Tracking and marking the All-Time High (ATH)
2. Fair Value Gaps (FVG) System
The indicator identifies and visualizes price gaps in market structure — zones that often act as magnets for future price movements:
Precise Identification of Inefficient Zones:
Bullish FVG: when the current candle's low is above the -2 candle's high
Bearish FVG: when the current candle's high is below the -2 candle's low
Detailed Visualization:
Clear display of upper and lower boundaries of each FVG
Midline (0.5 FVG) for determining key reaction levels within the gap
Marking each FVG with "FF" (Fair value Fill) label for quick identification
Dynamic Management:
Automatic removal of FVGs when they are filled by price movement
Customizable line extension for improved tracking of target zones
3. Intelligent Psychological Levels
The indicator automatically determines key psychological levels with adaptation to the type of instrument being traded:
Specialized Calibration for Various Assets:
Forex (EUR/USD, GBP/USD, USD/JPY): optimization for standard figures and round values
Precious metals (XAUUSD): adaptation to typical gold reaction zones with a $50 step
Cryptocurrencies (BTC, ETH): dynamic step adjustment depending on current price zone
Stock indices (NASDAQ, S&P500, DAX): accounting for the movement characteristics of each index
Smart Adaptation System:
Automatic determination of the optimal step for any instrument
Generation of up to 24 key levels, evenly distributed around the current price
Intelligent filtering to display only significant levels
Practical Application
Strategic Analysis
Identifying Key Structural Levels:
Use monthly and weekly fractals to determine strategic support/resistance zones
Look for coincidences of fractals with psychological levels to identify particularly strong zones of interest
Determine long-term barriers using type 5 fractals on higher timeframes
Analysis of Market Inefficiencies:
Track the formation of FVGs as potential targets for future movements
Use FVG midlines (0.5) as important internal reaction levels
Analyze the speed of FVG filling to understand trend strength
Tactical Trading Decisions
Entry Points and Risk Management:
Use bounces from fractals in the direction of the larger trend as a signal for entry
Place stop-losses behind fractal levels or key psychological levels
Monitor the formation of new fractals as a signal of potential reversal
Determining Target Levels:
Use unfilled FVGs as natural price targets
Apply nearby psychological levels for partial position closing
Project higher timeframe fractals to determine long-term goals
Indicator Advantages
Comprehensive Approach: combining three methodologies for a complete understanding of market structure
Intelligent Adaptation: automatic adjustment to the characteristics of different types of assets
Clean Visual Presentation: despite the abundance of information, the indicator maintains clarity of display
Effective Signal Filtering: automatic removal of completed levels to reduce visual noise
Higher Timeframe Optimization: specifically designed for daily, weekly and monthly charts
Usage Recommendations
Use the indicator only on D1, W, and M timeframes for the most reliable signals
Pay special attention to areas where different types of signals coincide (e.g., fractal + psychological level)
Use higher timeframe fractals as key zones for medium and long-term trading
Track FVGs as potential target zones and focus on their filling

Metatrader CalculatorThe “ Metatrader Calculator ” indicator calculates the position size, risk, and potential gain of a trade, taking into account the account balance, risk percentage, entry price, stop loss price, and risk/reward ratio. It supports the XAUUSD, XAGUSD, and BTCUSD pairs, automatically calculating the position size (in lots) based on these parameters. The calculation is displayed in a table on the chart, showing the lot size, loss in dollars, and potential gain based on the defined risk.

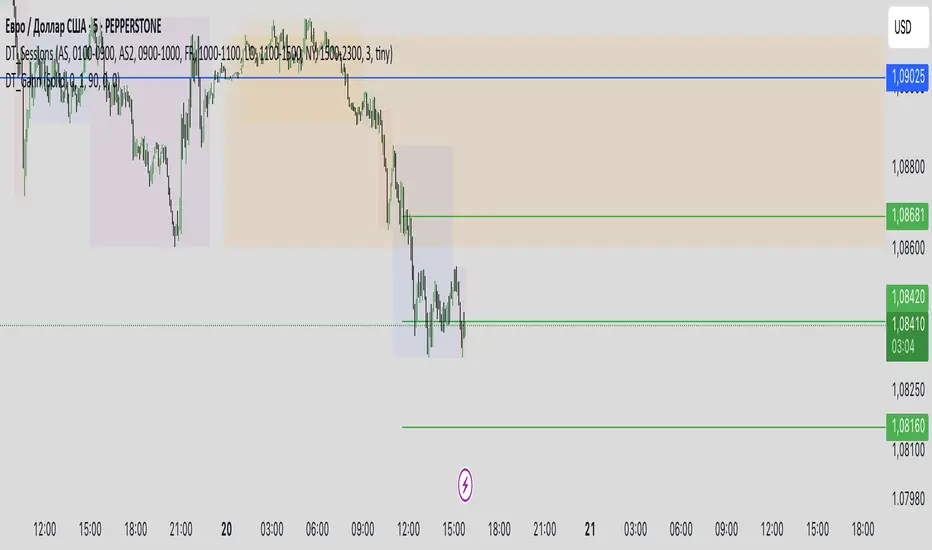
DT_Sessions TOPDT_Sessions TOP - Powerful Trading Sessions and Key Levels Indicator
Description
DT_Sessions is a versatile TradingView indicator that displays major trading sessions and important price levels on your chart. It's ideal for traders working in forex, cryptocurrency, and stock markets, helping to visualize critical market information directly on the chart.
Key Features:
Visualization of major trading sessions: Asian, Frankfurt, London, New York (AM and PM)
Previous day high and low (PDH/PDL) tracking
Display of key psychological levels for major trading instruments
Customizable colors and styles for all indicator elements
Flexible timezone management for accurate session synchronization
Benefits of Use
Enhanced market analysis: Understanding the activity of different trading sessions helps better interpret price movements
Trading time optimization: Visual display of the most volatile market periods
Key resistance and support levels: Automatic display of psychologically significant price levels
Daily extreme monitoring: PDH/PDL help in determining the trading range
Supported Instruments
The indicator automatically recognizes popular instruments, including:
Forex pairs (EUR/USD, GBP/USD, USD/JPY)
Cryptocurrencies (Bitcoin, Ethereum)
Stock indices (DAX, NASDAQ, S&P 500, EuroStoxx50)
Precious metals (XAU/USD)
How to Use
Add the indicator to your favorite asset's chart
Observe the trading session ranges highlighted in different colors
Use PDH/PDL lines to identify significant daily levels
Pay attention to key psychological levels for your instrument
Advanced Settings
The indicator offers numerous settings for each session:
Enable/disable individual sessions
Adjust start and end times for each session
Change colors and transparency
Configure PDH/PDL display
Manage timezones and UTC offset
Effective For
Scalpers and day traders
Long-term investors tracking key levels
Algorithmic traders needing session data visualization
Beginners studying the impact of trading sessions on market activity
DT_Sessions is an essential tool for traders of all levels, providing valuable information about market dynamics and key levels directly on your TradingView chart.

Multiple MAsHere's a well-written description in English for your "Multiple MAs" indicator that you can use when publishing on TradingView. It’s concise, professional, and highlights the key features of the indicator while explaining its purpose for traders.
---
### Multiple MAs Indicator
#### Overview
The **Multiple MAs** indicator is a versatile and straightforward tool designed to help traders visualize price trends using multiple Simple Moving Averages (SMAs) on a single chart. By plotting six SMAs with customizable lengths (MA5, MA10, MA20, MA50, MA100, and MA200), this indicator provides a clear view of short-term, medium-term, and long-term trends, making it ideal for trend-following strategies, crossover analysis, and identifying potential support/resistance levels.
#### Features
- **Customizable MA Lengths**: Adjust the periods of all six moving averages (MA5, MA10, MA20, MA50, MA100, MA200) to suit your trading style and timeframe.
- **Distinct Visuals**: Each MA is plotted with a unique color and line width for easy identification:
- MA5 (Dodger Blue, 1px)
- MA10 (Green, 1px)
- MA20 (Red, 2px)
- MA50 (Purple, 3px)
- MA100 (Gray, 3px)
- MA200 (White, 3px)
- **Overlay on Price Chart**: The indicator overlays directly on the price chart, allowing for seamless integration with other technical analysis tools.
- **High Precision**: Displays values with 8-decimal precision, ensuring accuracy for assets with small price movements (e.g., forex pairs or cryptocurrencies).
#### How to Use
1. **Trend Identification**: Use the longer MAs (e.g., MA100, MA200) to determine the overall trend direction. If the price is above these MAs, the trend is likely bullish; if below, it’s likely bearish.
2. **Crossover Signals**: Look for crossovers between shorter MAs (e.g., MA5 crossing MA20) for potential entry or exit signals. For example:
- A bullish signal occurs when a shorter MA crosses above a longer MA.
- A bearish signal occurs when a shorter MA crosses below a longer MA.
3. **Support and Resistance**: MAs often act as dynamic support or resistance levels. Watch for price reactions around these lines, especially the MA50, MA100, and MA200.
4. **Divergence Analysis**: Compare the slope of different MAs to identify potential trend reversals or weakening momentum.
#### Settings
- **MA5 Length**: Default is 5 bars.
- **MA10 Length**: Default is 10 bars.
- **MA20 Length**: Default is 20 bars.
- **MA50 Length**: Default is 50 bars.
- **MA100 Length**: Default is 100 bars.
- **MA200 Length**: Default is 200 bars.
#### Best Practices
- **Timeframe**: This indicator works on any timeframe but is particularly effective on daily, 4-hour, and 1-hour charts for swing trading or trend-following strategies.
- **Combine with Other Tools**: Pair the Multiple MAs with other indicators like RSI, MACD, or volume analysis to confirm signals and avoid false breakouts.
- **Adjust for Volatility**: For highly volatile assets, consider increasing the MA lengths to reduce noise and focus on broader trends.
#### Notes
- The indicator is lightweight and optimized for performance, ensuring it runs smoothly even on lower timeframes.
- Colors and line widths are pre-set for clarity but can be customized in the indicator settings if needed.
#### Credits
Created by kosar_v. Feedback and suggestions are welcome to improve this tool for the TradingView community!

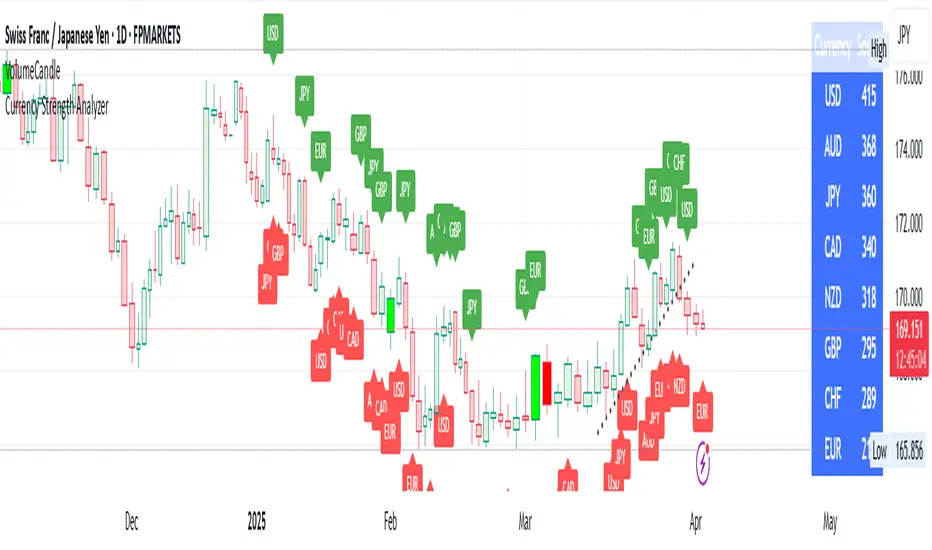
Currency Strength AnalyzerThis indicator calculates and ranks the strength of eight major currencies (AUD, CAD, CHF, EUR, GBP, JPY, NZD, USD) based on a stochastic-based scoring system. It retrieves forex pair data and determines each currency's relative strength using a customized scoring method.
Features:
Uses stochastic (Stoch) indicators to calculate bullish/bearish strength.
Aggregates scores for each currency based on multiple forex pairs.
Sorts currencies from strongest to weakest.
Displays results in a dynamically updated table.
Highlights the strongest and weakest currencies on the chart.
This tool helps traders identify potential trends and reversals in the forex market by visually comparing currency strengths in real-time.
RiskCalc FX & GoldRiskCalc FX & Gold is a multi-market position sizing tool designed to help you manage risk quickly and accurately. With this script, simply enter your account capital, the percentage of risk you wish to take, and your stop in ticks. Depending on the selected market—Forex or XAUUSD—the script automatically adjusts its calculations:
Forex: Assumes 1 lot equals 100,000 units.
XAUUSD: Assumes 1 lot equals 100 ounces.
The script calculates your risk in dollars and, using a fixed value of 1 USD per tick per lot, determines the ideal position size in both lots and total contracts. Results are displayed in a clear, centralized table at the top of the chart for real-time decision-making.
Perfect for traders operating across multiple markets who need an automated and consistent approach to risk management.

Sentiment OscillatorIn the complex world of trading, understanding market sentiment can be like reading the emotional pulse of financial markets. Our Sentiment Oscillator is designed to be your personal market mood translator, helping you navigate through the noise of price movements and market fluctuations.
Imagine having a sophisticated tool that goes beyond traditional price charts, diving deep into the underlying dynamics of market behavior. This indicator doesn't just show you numbers – it tells you a story about market sentiment, combining multiple financial signals to give you a comprehensive view of potential market directions.
The Sentiment Oscillator acts like a sophisticated emotional barometer for stocks, cryptocurrencies, or any tradable asset. It analyzes price changes, market volatility, trading volume, and long-term trends to generate a unique sentiment score. This score ranges from highly bullish to deeply bearish, providing traders with an intuitive visual representation of market mood.
Green zones indicate positive market sentiment, suggesting potential buying opportunities. Red zones signal caution, hinting at possible downward trends. The oscillator's gray neutral zone helps you identify periods of market uncertainty, allowing for more calculated trading decisions.
What sets this indicator apart is its ability to blend multiple market factors into a single, easy-to-understand indicator. It's not just about current price – it's about understanding the deeper currents moving beneath the surface of market prices.
Traders can use this oscillator to:
- Identify potential trend reversals
- Understand market sentiment beyond price movement
- Spot periods of market strength or weakness
- Complement other technical analysis tools
Whether you're a day trader, swing trader, or long-term investor, the Sentiment Oscillator provides an additional layer of insight to support your trading strategy. Remember, no indicator is a crystal ball, but this tool can help you make more informed decisions in the dynamic world of trading.

Previous Day, Week, Monday Liq + Asian, London & Ny session LiqGM Gs,
This indicator helps traders identify key liquidity levels from different market sessions (Asian, London, NY), as well as weekly and daily highs/lows. It automatically plots these levels on the chart, making it easier to spot potential support/resistance zones where price might react.
Key Features:
1. Multi-Timeframe Liquidity Zones
Previous Day High/Low – Tracks the prior day’s range.
Monday High/Low – Useful for weekly opening liquidity.
Previous Week High/Low – Helps identify broader weekly levels.
2. Customizable Session Times
Asian, London, and NY Session Highs/Lows – Automatically detects and plots key levels from each trading session.
Adjustable Time Zones – Supports multiple GMT offsets (GMT-8 to GMT+3), making it adaptable for traders worldwide.
3. Visual Customization
Color & Style Options – Each level type (e.g., London High, NY Low) can be customized in color, line style (solid, dashed, dotted), and width.
Faded Opacity for Swept Levels – When a level is swept (price breaks but closes beyond it), it becomes semi-transparent, helping traders distinguish active vs. invalidated levels.
4. Clean & Informative Labels
Each level has a clear label (e.g., "Asia High," "PW Low") for easy identification.
Adjustable label offsets prevent clutter on the chart.
Pros & Benefits for Traders:
✅ Helps Identify Key Liquidity Zones – Institutional traders often target session highs/lows for liquidity grabs. This indicator makes these levels visible at a glance.
✅ Adaptable to Different Trading Styles
Day Traders – Can use Asian/London/NY session levels for intraday setups.
Swing Traders – Can focus on weekly and Monday levels for broader trends.
✅ No Repainting – Levels are fixed once formed and do not change retroactively.
✅ Customizable for Personal Preference – Traders can adjust colors, line styles, and visibility to match their trading setup.
✅ Useful for Multiple Markets – Works well on Forex (major pairs), indices, and even crypto (due to 24/7 market structure similarities).
Suggested Use Cases:
Breakout Trading – Watch for price reactions at session highs/lows.
Mean Reversion – Fade moves into weekly or daily extremes.
Institutional Liquidity Analysis – Identify potential stop hunts or accumulation zones.
Conclusion:
This indicator is a powerful tool for traders who rely on session-based liquidity, institutional order flow, and key support/resistance levels. By automating the detection of these zones, it saves time and helps traders make more informed decisions.

Daily Movement AnalysisDaily Volatility Explorer: 7-Day Market Pulse Indicator
Unlock the hidden rhythms of market movements with this powerful analytical tool designed for both traditional and crypto traders. This indicator meticulously tracks and analyzes price volatility patterns across all seven days of the week, giving you a strategic edge in planning your trades.
🎯 Key Features:
• Dynamic 3-month rolling analysis of daily price movements
• Real-time volatility comparison across all trading days
• Clear visual representation through color-coded bar charts
• Detailed statistical table with exact pip movements
• Sample size tracking for statistical reliability
• Works seamlessly on both traditional and crypto markets
💡 Why Traders Need This:
1. Optimal Trade Timing
- Identify the most volatile trading days for maximum opportunity
- Discover the quietest days to avoid choppy markets
- Perfect for swing traders and day traders alike
2. Risk Management Enhancement
- Set smarter stop-losses based on typical daily ranges
- Adjust position sizes according to daily volatility patterns
- Avoid overtrading during historically low-volatility periods
3. Strategic Planning
- Plan your trading week around peak volatility days
- Optimize entry and exit points based on historical movements
- Better time management by focusing on the most active days
4. Market Psychology Insights
- Understand weekly market rhythm and institutional patterns
- Identify how weekend gaps affect crypto markets
- Spot changes in market behavior across different days
🔍 Perfect For:
• Forex traders tracking major currency pairs
• Crypto traders navigating 24/7 markets
• Gold and commodity traders
• Day traders optimizing their trading schedule
• Swing traders planning optimal entry/exit days
📊 Data-Driven Decisions:
The indicator maintains a rolling 3-month window of data, providing fresh, relevant insights while filtering out outdated patterns. Each day's analysis is based on actual market movements, giving you reliable, actionable intelligence for your trading decisions.
⚡ Pro Tip: Use this indicator alongside your existing strategy to enhance your trading plan and improve your timing. The color-coded visual system makes it easy to spot patterns at a glance, while the detailed statistics table provides the hard numbers you need for precise planning.
Remember: Markets evolve, and this indicator helps you stay on top of changing patterns in real-time. Whether you're trading traditional markets or crypto, understanding daily volatility patterns is crucial for consistent trading success.

DT_GannDT_Gann - Combined Indicator Description
This TradingView indicator implements W.D. Gann's Square 9 concept with several visual enhancements to help traders identify key support and resistance levels. The indicator automatically adapts to different market types (forex or stocks) and includes the following features:
KEY FEATURES:
Support and resistance levels:
Automatically calculates and displays multiple support and resistance levels based on the Gann square theory of 9, with customizable colors (default green for support, red for resistance).
Day Opening Line:
Shows the day's opening price as a reference point, which serves as the base for all Gann calculations.
Previous 4H Range Box:
Displays a rectangular box showing the high-llow range of the previous day's last 4-hour candle, helping traders identify important price zones.
Vertical Time Lines:
Additional temporary vertical lines marking 4-hour intervals to help visualize potential reversal points.
Reject Mode:
Allows you to fine-tune support and resistance levels using percentage deviations.
CUSTOMIZATION OPTIONS:
Line Styles:
Select a solid, dashed, or dotted line.
Colors:
Adjust colors for support, resistance, daily open line, 4H rectangle and time lines.
Line Width:
Customize the thickness of all lines (1-5 pixels)
Opacity settings:
Control the transparency of various elements
Deviation settings:
Apply percentage adjustments to support and resistance levels
TECHNICAL IMPLEMENTATION:
Indicator:
- Automatically determines the appropriate point values depending on the instrument.
- Calculates Gann levels using the mathematical principle of Square 9.
- Finds the nearest support and resistance levels relative to the current price.
- Creates visualizations based on both charts and lines.
- Dynamically updates as price moves.
USAGE:
This indicator is especially useful for swing traders and day traders who follow Gann methods. The combination of price levels (support/resistance) and time markers (vertical lines) helps identify potential reversal zones where price and time align according to Gann principles.
The previous day's 4-hour rectangular frame often serves as an important reference zone that price can return to or respect.
The indicator works on all timeframes, but is most effective on charts from 15-minute to 4-hour charts, where time-based components provide the most value.
CAM | Comparison and Normalisation Indicator Description: "CAM | Comparison and Normalisation" 🌟
Overview 📊
The "CAM | Comparison and Normalisation" indicator is a must-have tool for forex traders! 🚀 It analyzes the strength of a currency pair’s base and quote currencies against the pair’s price movement, using automatic detection, composite calculations, and normalization—all wrapped in a colorful, easy-to-read package. 🎨
How It Works 🛠️
- 🔍 **Automatic Currency Detection**: Instantly spots the base (e.g., EUR in EURUSD) and quote (e.g., USD) currencies—no manual setup needed!
- 💪 **Composite Strength Calculation**: Measures each currency’s power by averaging its rate against 9 major currencies (GBP, EUR, CHF, USD, AUD, CAD, NZD, JPY, NOK). A true strength test! 🏋️♂️
- 📏 **Normalization**: Scales everything with a smart formula (price minus moving average, divided by standard deviation) so base, quote, and pair prices play on the same field. ⚖️
- 🎨 **Dynamic Visualization**:
- Plots 3 normalized lines with unique colors:
- **Base Composite** (e.g., purple for GBP, blue for EUR)
- **Quote Composite** (e.g., green for USD, yellow for JPY)
- **Actual Pair** (⚪ white)
- Adds labels on the last bar (e.g., "Base: GBP" in purple). 🏷️
- 📊 **Performance Histogram**: Shows the base vs. quote strength gap with a green (👍) or red (👎) area chart—adjusted by the pair’s price.
- ⚙️ **Customizable Settings**: Adjust Scaling Period (50), Histogram Scale (0.5), and Levels (1, -1) to fit your style! 🎚️
Benefits 🌈
- 🧠 **Simplified Analysis**: Normalized data cuts through the noise, making trends crystal clear.
- ✅ **Enhanced Decisions**: Colorful lines and histograms spotlight trading signals fast.
- ⏱️ **Time-Saver**: No setup—just drop it on a chart and go!
- 🌍 **Versatile**: Works on any supported pair, with colors adapting automatically (e.g., orange AUD on AUDCAD).
- 👀 **Eye-Catching**: Currency-specific colors (like purple GBP from pound notes) make it fun and easy to follow.
How It Helps Traders 💡
- 📈 **Spot Trends**: See if the base is flexing 💪 or the quote is fading 📉, and how it ties to the pair’s price.
- ⚠️ **Catch Divergences**: Histogram flags when currency strength and price don’t match—hello, opportunity! 🚨
- 🛡️ **Manage Risk**: Normalized values and levels help gauge overbought/oversold zones for smarter stops.
- **Big Picture**: Compare currency strength to pair price for strategic edge, whether scalping or swinging.
Example in Action 🎬
- **GBPUSD Chart**:
- purple GBP line climbs, greenUSD dips, histogram turns green 👍—GBP’s gaining! If the white pair line rises too, it’s a bullish hint.
Conclusion ✨
"CAM | Comparison and Normalisation" turns forex complexity into clear, actionable insights. With its auto-detection, vibrant visuals, and trader-friendly design, it’s your shortcut to smarter trades! 📈💰

GRID EXTENSIONGRID EXTENSION
Overview
The GRID EXTENSION is a simple grid-based indicator for TradingView, built with Pine Script v6. It plots horizontal price levels starting from a user-defined anchor price, with spacing set by a tick increment. Use it to identify key support, resistance, or price zones on charts for Crypto, Forex, or Futures.
Key Features
Custom Grid Levels: Plot up to 22 levels (e.g., 0, 0.25, 1.25, -2.50) with options to show/hide, set values, and choose colors.
Market-Specific Tick Increments: Select your asset type (Crypto, Forex, Futures) and choose from a range of tick increments tailored for each market:
Crypto: 1 to 5000 ticks (e.g., 100 ticks = $0.001 on ADA/USD, 5000 ticks = $50 on BTC/USD).
Forex: 5 to 5000 ticks (e.g., 100 ticks = 1 pip on EUR/USD, 5000 ticks = 50 pips).
Futures: 1 to 2500 ticks (e.g., 25 ticks = 6.25 points on E-mini S&P 500, $312.50 per contract).
Visual Options:
Extend lines to the right.
Show price and level labels (as values or percentages).
Place labels on the left or right.
Adjust background transparency for filled areas between levels.
How to Use
Set Asset Type: Choose "Crypto," "Forex," or "Futures" to match your chart.
Set Anchor Price: Enter a starting price for the grid.
Pick Tick Increment: Select a tick increment from the dropdown, following the guidance for your asset type (see Key Features).
Customize Levels: Turn levels on/off, set values, and pick colors.
Add to Chart: Apply the indicator to see the grid on your chart.
Tips
Use levels to mark support/resistance zones for entries or exits.
Extend lines to project future price zones.
Choose smaller increments (e.g., 5 ticks) for scalping, or larger ones (e.g., 1000 ticks) for swing trading.
Combine with indicators like moving averages for better signals.
Settings
Asset Type: Select "Crypto," "Forex," or "Futures" (default: "Crypto").
Anchor Price: Starting price for the grid (default: 0.0).
Tick Increment: Space between levels (options: 1, 5, 10, 25, 50, 100, 250, 500, 1000, 2500, 5000). Choose based on asset type.
Extend Right: Extend lines to the right (default: true).
Show Prices: Show price labels (default: true).
Show Levels: Show level values or percentages (default: true).
Format: Display levels as "Values" or "Percent" (default: "Values").
Labels Position: Place labels on "Left" or "Right" (default: "Left").
Background Transparency: Set transparency for filled areas (default: 100, range 0-100).
Level Options: Enable/disable levels, set values, and choose colors.
Notes
Set the anchor price to a key level (like a recent high or low) for best results.
Check the tick increment tooltip to ensure the spacing suits your market type.
Works on any chart, best for clear price trends or ranges.
Acknowledgments
Made with Pine Script v6 for TradingView. This is v1.0—feedback welcome for future updates!

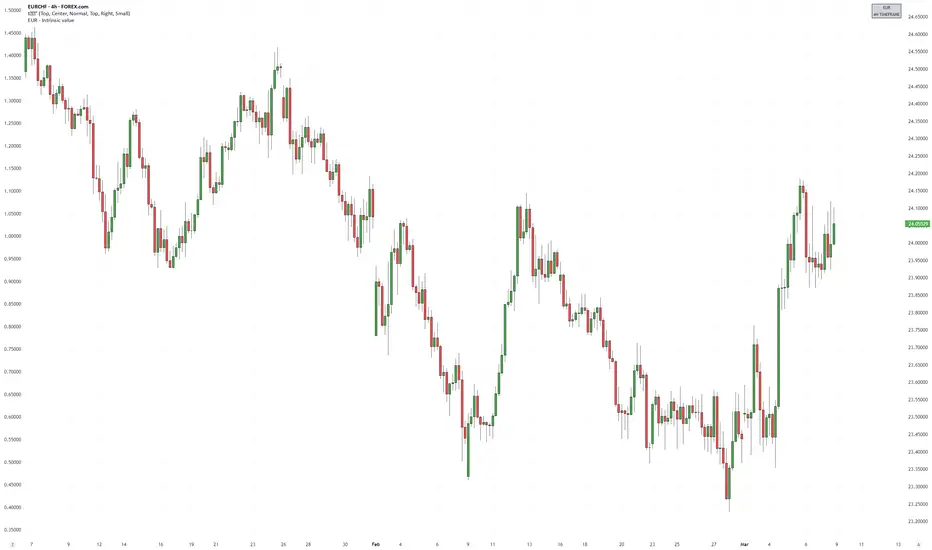
EUR - Intrinsic value🔹 Introduction
The EUR - Intrinsic Value indicator is a unique tool that reconstructs the intrinsic value of the euro by aggregating the main Forex pairs associated with the EUR. This indicator provides a clearer view of the overall trend of the euro , independently of any specific currency pair.
It allows traders to better anticipate movements in EURUSD , especially when combined with the U.S. Dollar Index (DXY) . By analyzing both, traders can identify moments of strong momentum and optimize their trade entries.
🔹 How to Use the Indicator?
1️⃣ Add the Indicator to a Chart: The indicator plots candles representing the intrinsic value of the EUR (see Technical information below).
2️⃣ Analyze the DXY Trend:
🔵 If DXY is rising → Bearish momentum likely for EURUSD and other USD pairs.
🔴 If DXY is falling → Bullish momentum likely for EURUSD and other USD pairs.
⚫ If DXY is ranging → Consolidation likely, be cautious of false breakouts .
3️⃣ Confirm with EUR:
🔥 DXY falling + EUR rising → EURUSD likely to surge with strong momentum 📈
❄️ DXY rising + EUR falling → EURUSD likely to drop with strong momentum 📉
4️⃣ Adjust Strategy Based on Context: Wait for confirmations at key support/resistance levels and use other tools to validate trade entries.
🔹 What Value Does This Indicator Provide ?
The EUR - Intrinsic Value indicator offers multiple advantages for trading EURUSD and other EUR-related pairs:
✅ Trend Identification: Determine if the euro is in an uptrend, downtrend, or consolidation phase , regardless of individual currency fluctuations.
✅ Better Trade Timing: Combining this indicator with the Dollar Index (DXY) helps detect setups where EURUSD is likely to experience strong momentum .
✅ A Complementary Tool for Price Action : Use this indicator alongside other technical tools to confirm optimal trade entry/exit points.
🔹 Visual Examples
Shift in market structure in DXY and in EUR in the same time , giving a trend and strong momentum on EURUSD :
This indicator works on any timeframe (even sub 1m)
Note : I use Watermark° script from toodegrees , to show the currency and the timeframe on the top right of charts.
🔹 How Does the Indicator Work?
The indicator is based on a weighted average of the euro’s movements against seven major currencies:
📌 Currencies Included in the Calculation:
EURUSD (Euro vs U.S. Dollar)
EURCAD (Euro vs Canadian Dollar)
EURGBP (Euro vs British Pound)
EURCHF (Euro vs Swiss Franc)
EURAUD (Euro vs Australian Dollar)
EURNZD (Euro vs New Zealand Dollar)
EURJPY (Euro vs Japanese Yen)
The indicator extracts opening, closing, high, and low prices from each pair and create an independent value of the EUR , displayed as a custom candle chart.
🔹 Why Is This Indicator Unique?
Unlike traditional indicators that rely on a single pair, this tool artificially recreates an index for the euro by combining multiple currency pairs. This gives a broader perspective and helps traders to better time entry/exit points .
Rather than relying on a simple average , it accounts for the dynamic changes in EUR across multiple markets simultaneously .
🔹 Technical Information
📊 Display: Custom candles representing the intrinsic value of the EUR.
⏳ Supported Timeframes: Compatible with all timeframes.
⚠️ Limitations:
This indicator does not provide direct buy/sell signals but serves as a contextual tool to improve EUR trading decisions.
This is an indicator, it means you can't use other indicators on it .
You can draw on it, but your draws will not be able to stay magnet to the EUR indicator
Follow this three simple steps below to use this indicator on TradingView :
Select any forex pair on your chart (important to get a correct chart)
Hide it by clicking the 3 dots and then "Hide"
Add the "EUR - Intrisic value" indicator to your chart and set it as Full screen
🔹 Conclusion
The EUR - Intrinsic Value indicator is a powerful tool for traders looking to anticipate euro movements in the Forex market. By combining it with DXY and other technical analysis tools, it provides a clearer understanding of trading opportunities , reducing false signals and improving decision-making.
🚀 Use this indicator to refine your trade entries and capitalize on the best market opportunities! 🔥
⚠️ Terms and Conditions ⚠️
This financial tool is for educational purposes only and not financial advice. Users assume responsability for decisions made based on the tool's information.
Past performance doesn't guarantee future results.
By using this tool, users agree to these terms.
FinFluential Global M2 Money Supply // Days Offset =The "Global M2 Money Supply" indicator calculates and visualizes the combined M2 money supply from multiple countries and regions worldwide, expressed in trillions of USD.
M2 is a measure of the money supply that includes cash, checking deposits, and easily convertible near-money assets. This indicator aggregates daily M2 data from various economies, converts them into a common USD base using forex exchange rates, and plots the total as a single line on the chart.
It is designed as an overlay indicator aligned to the right scale, making it ideal for comparing global money supply trends with price action or other market data.
Key Features
Customizable Time Offset: Users can adjust the number of days to shift the M2 data forward or backward (from -1000 to +1000 days) via the indicator settings. This allows for alignment with historical events or forward-looking analysis.
Global Coverage Includes:
Eurozone: Eurozone M2 (converted via EUR/USD)
North America: United States, Canada
Non-EU Europe: Switzerland, United Kingdom, Finland, Russia
Pacific: New Zealand
Asia: China, Taiwan, Hong Kong, India, Japan, Philippines, Singapore
Latin America: Brazil, Colombia, Mexico
Middle East: United Arab Emirates, Turkey
Africa: South Africa
